Getting Started
This is meant to be a quick introduction to the features of Observa’s customer portal and reporting. Not a full documentation on everything, as you should login and try it out with your data. We made it to explore and discover!
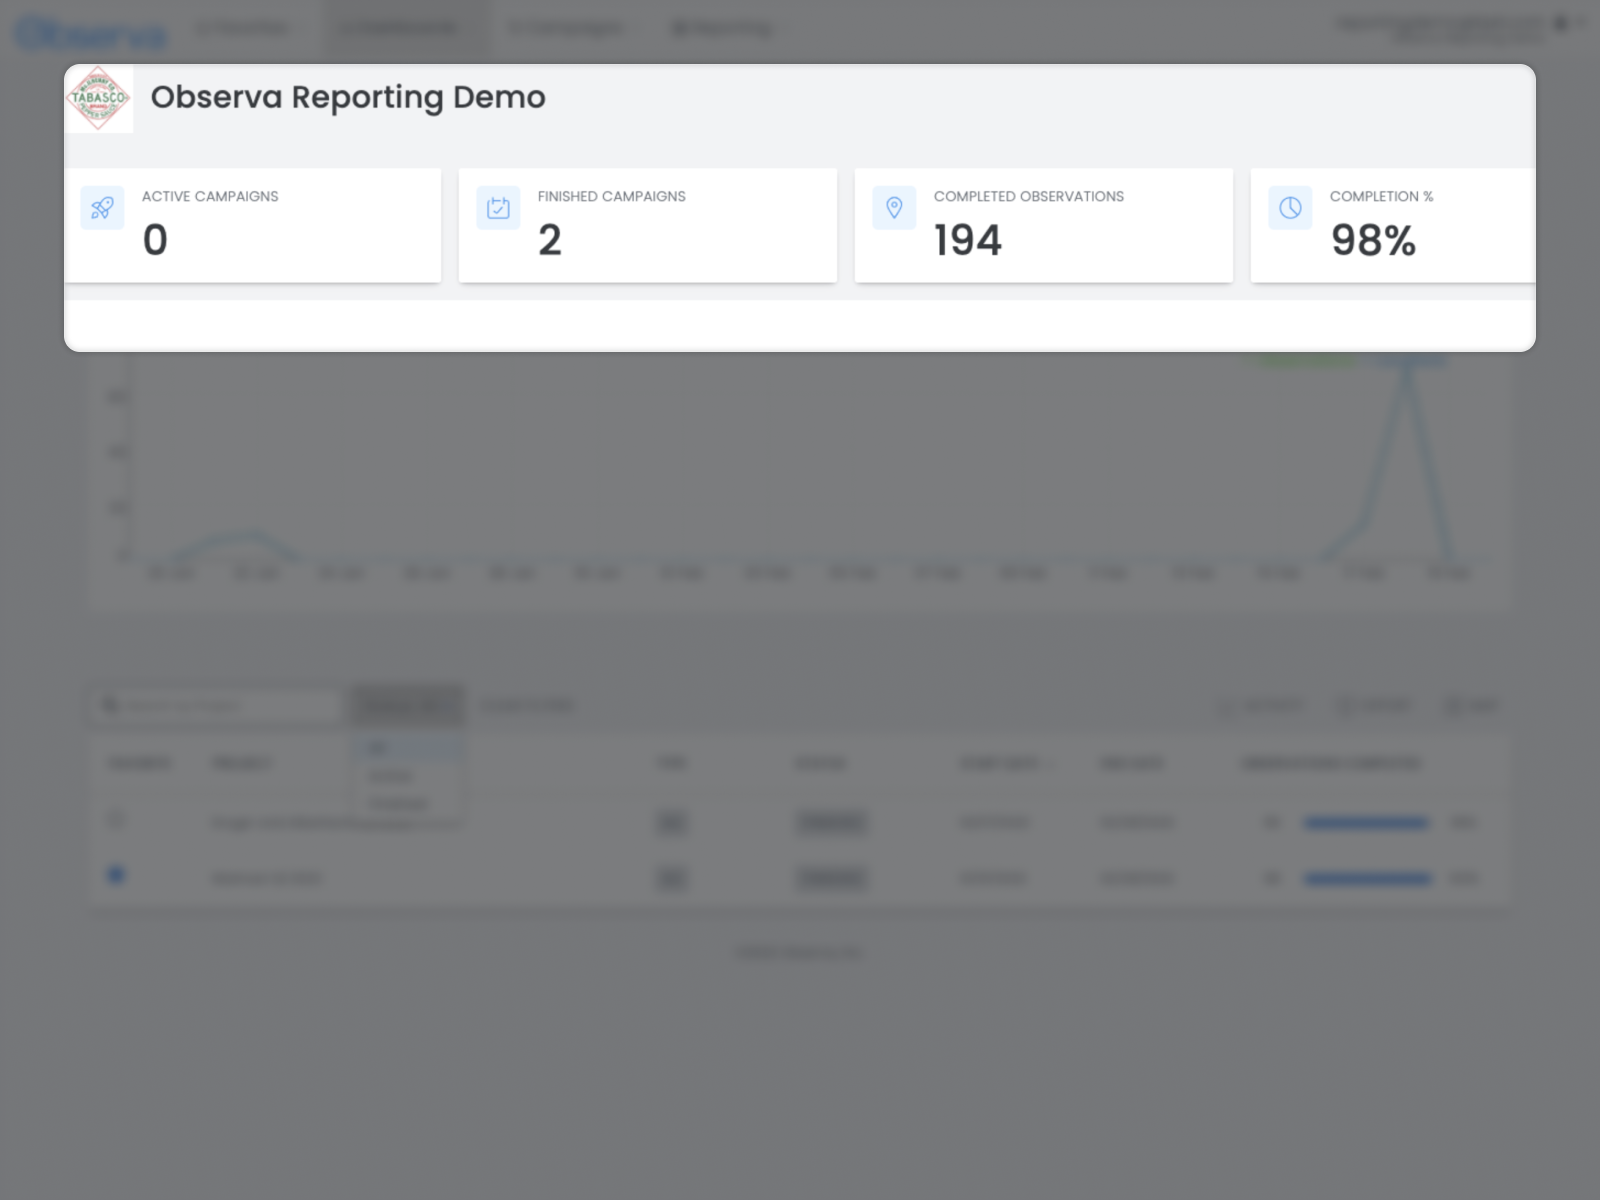
Landing Page
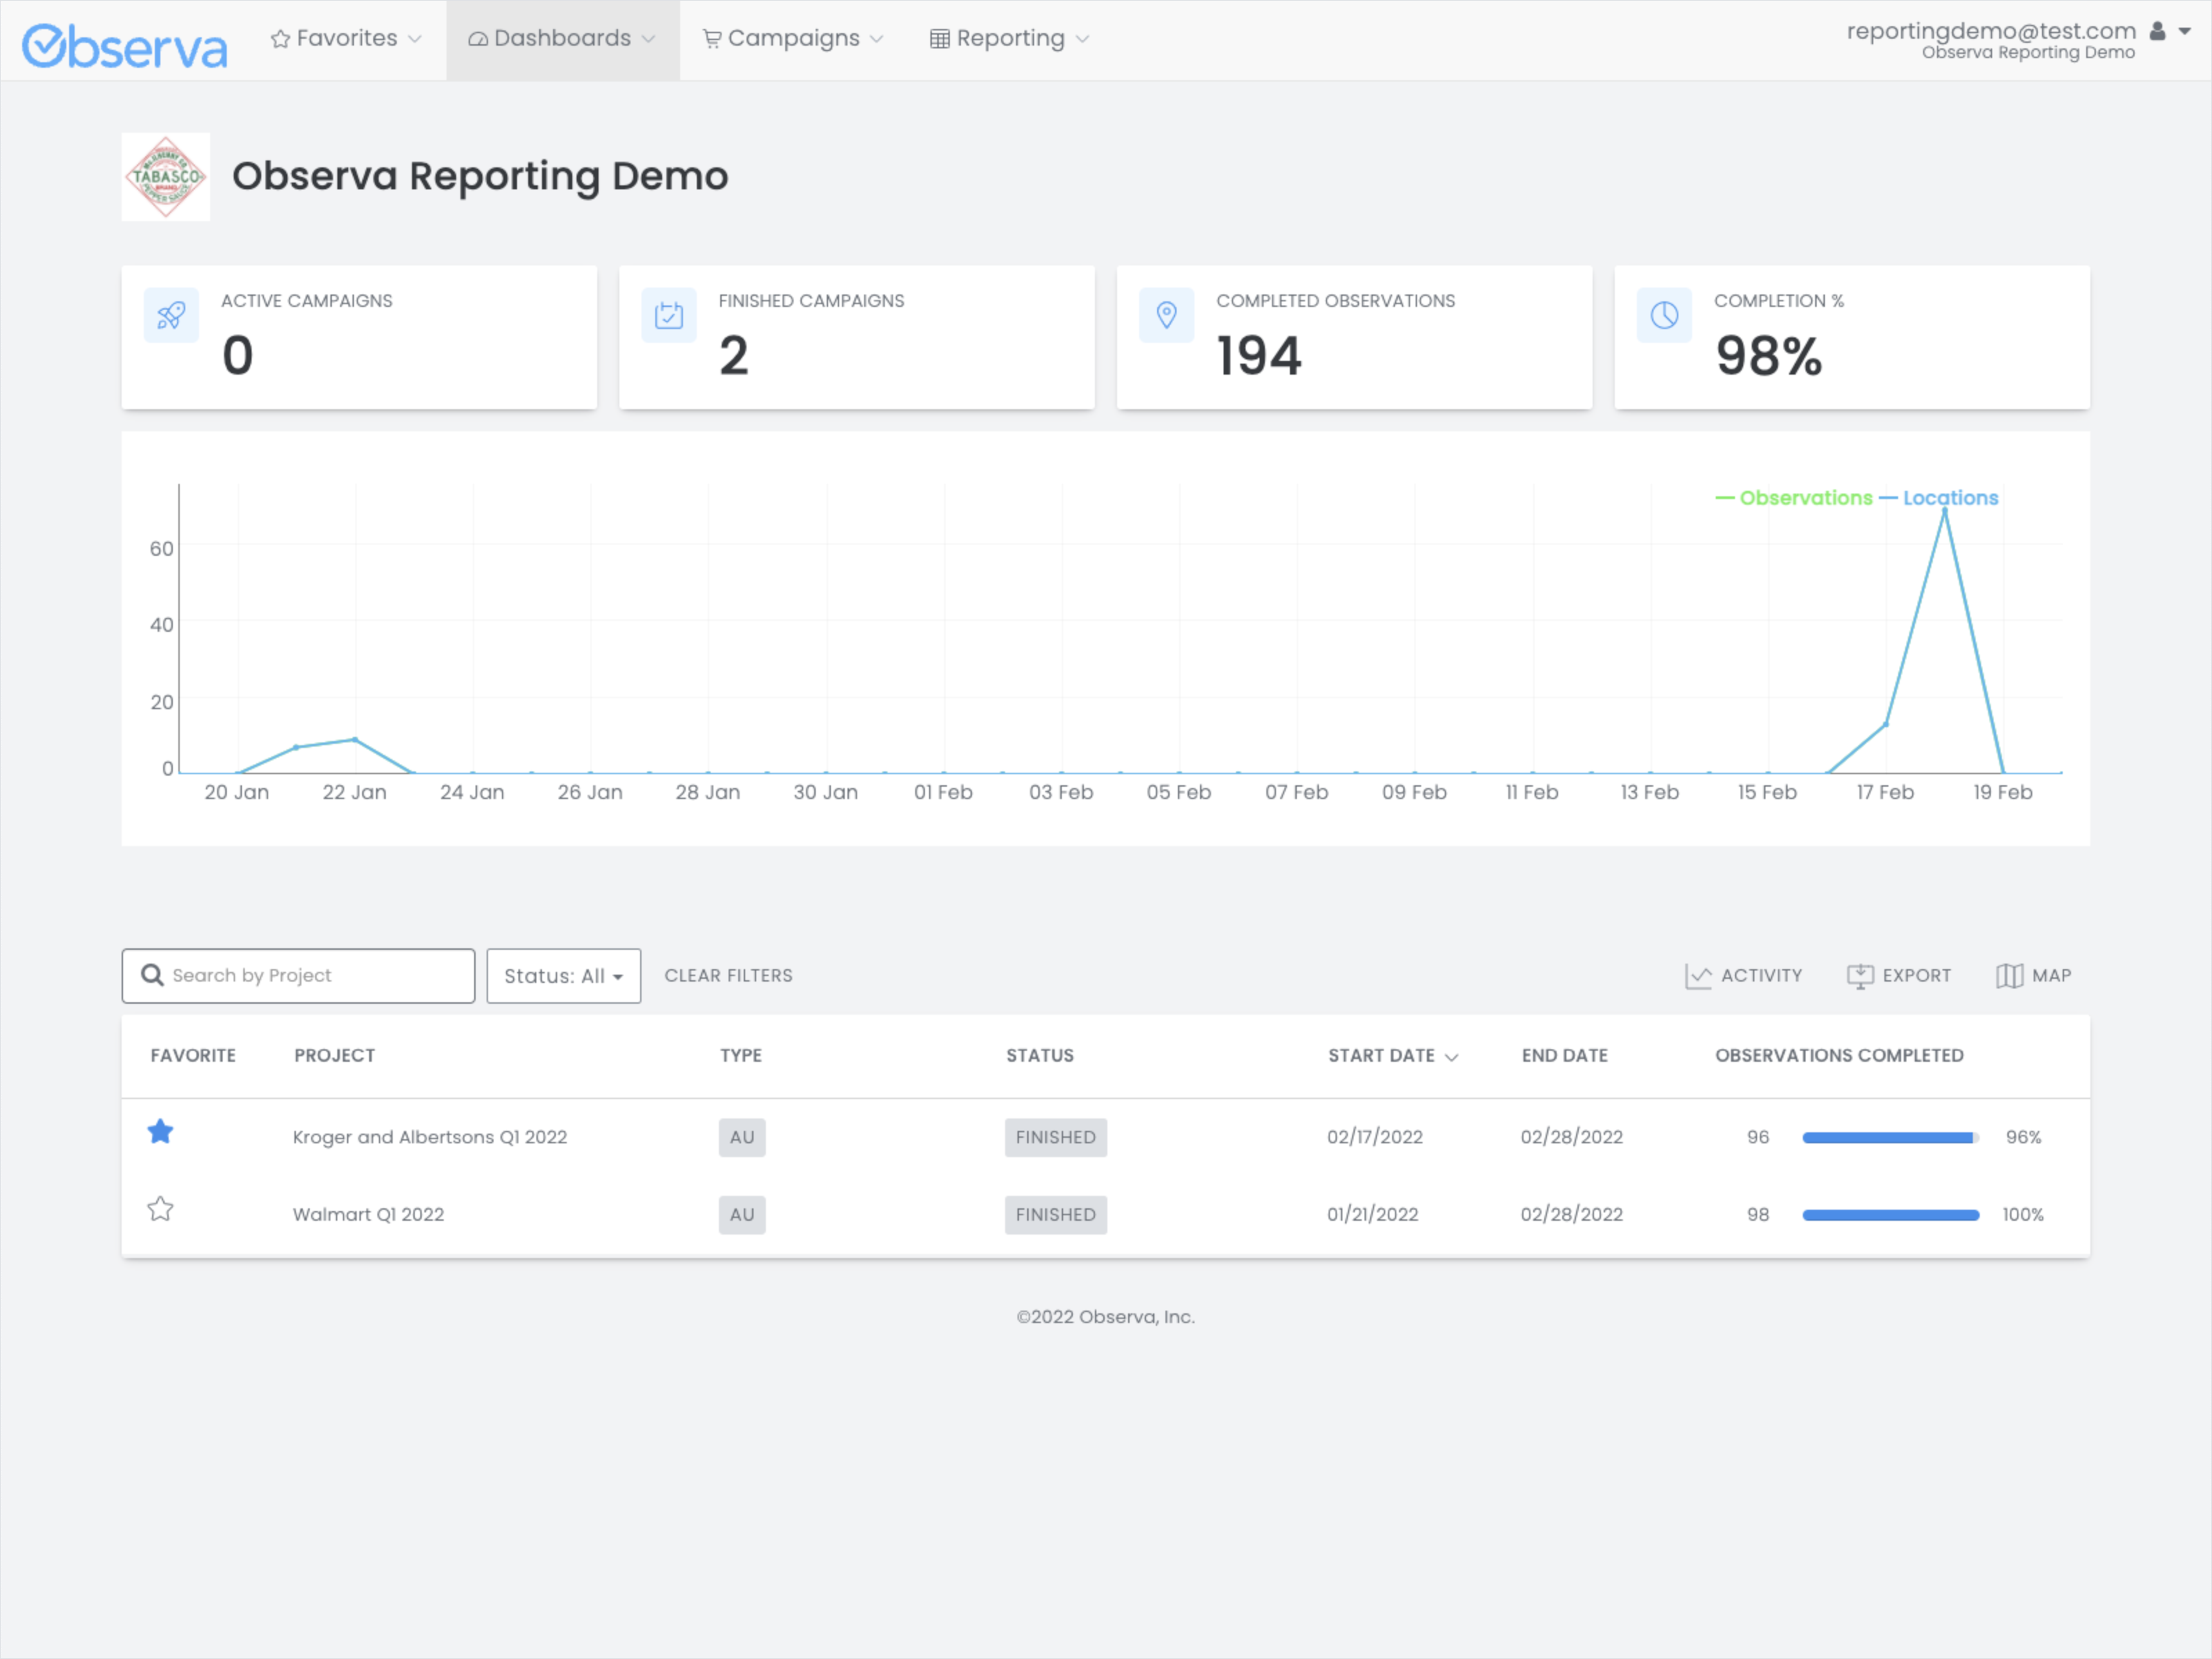
This is where you’ll find all of your projects with Observa, both active and finished. The default shows you what’s going on and lets you drill down into the projects, campaigns, and observations.
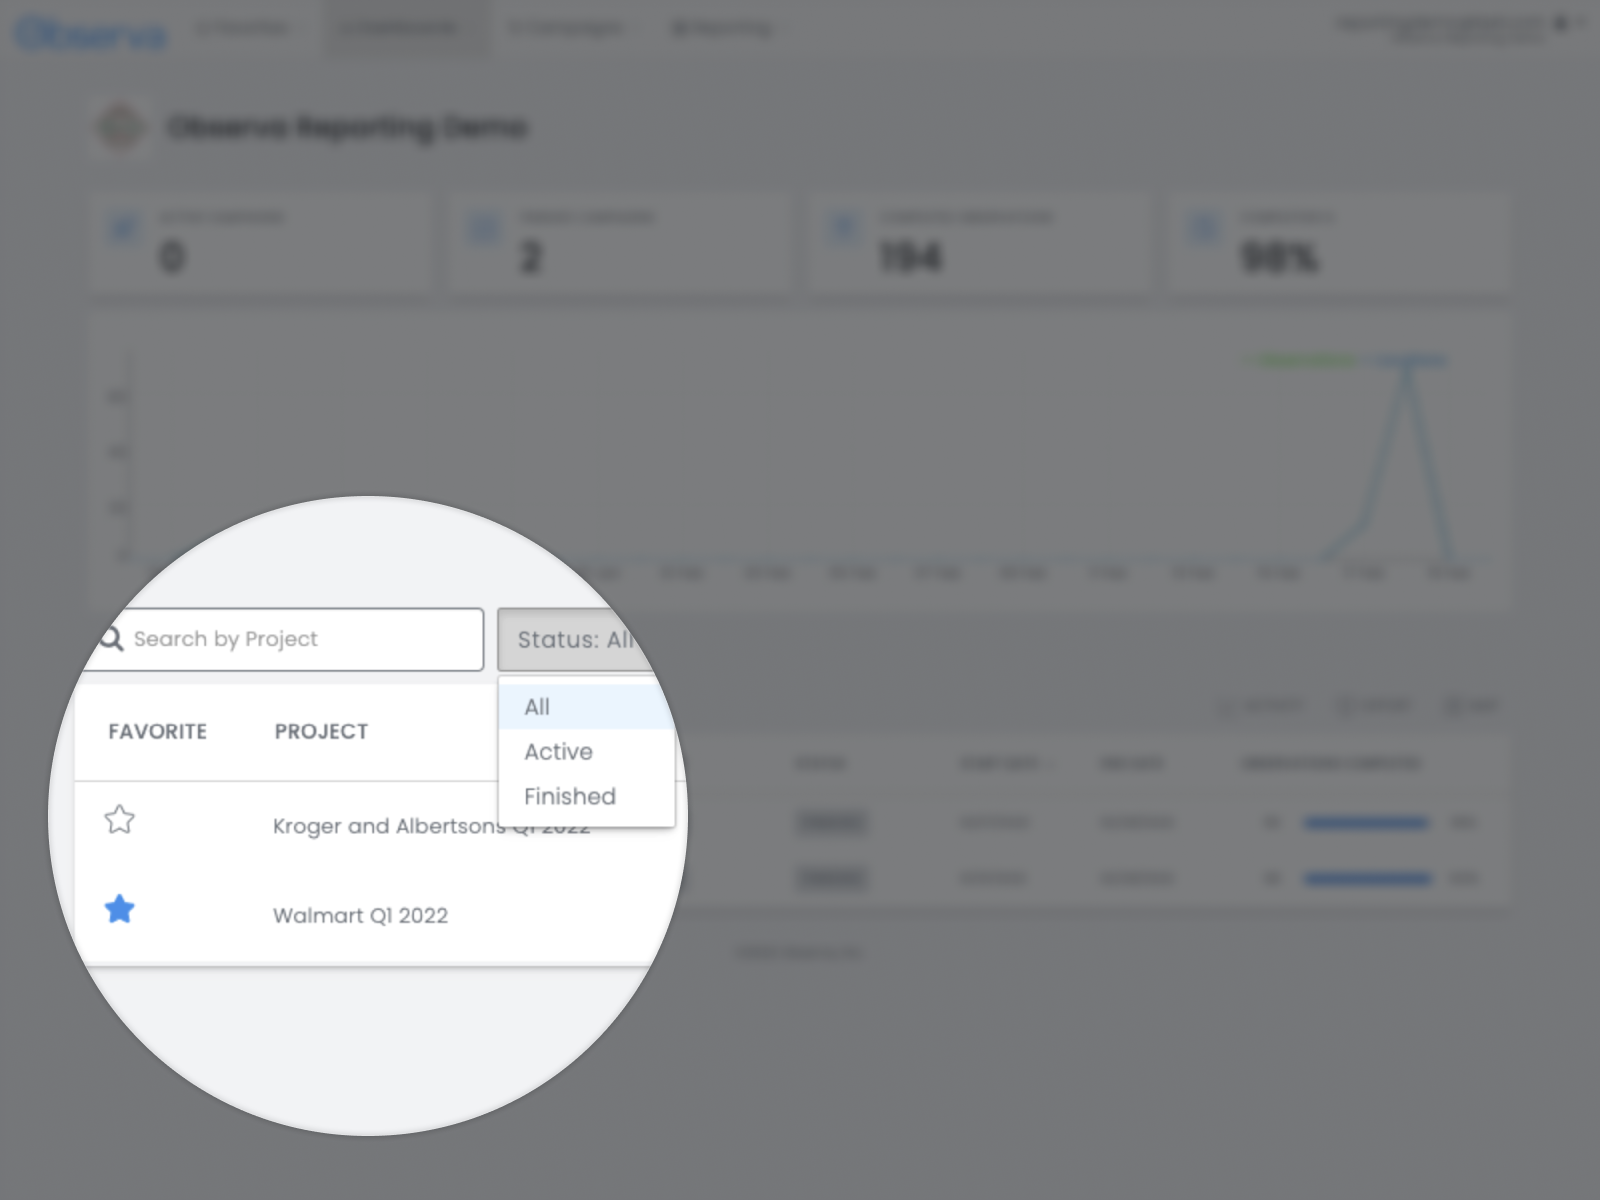
Filter on Status and Search Bar
Projects, campaigns, and observations all have a status. They can be Active or Finished. This filter lets you see items based on the status. You can also type search terms into the search field to further refine your filter. Very useful when you have lots of projects!
Completed Observations Quick Look
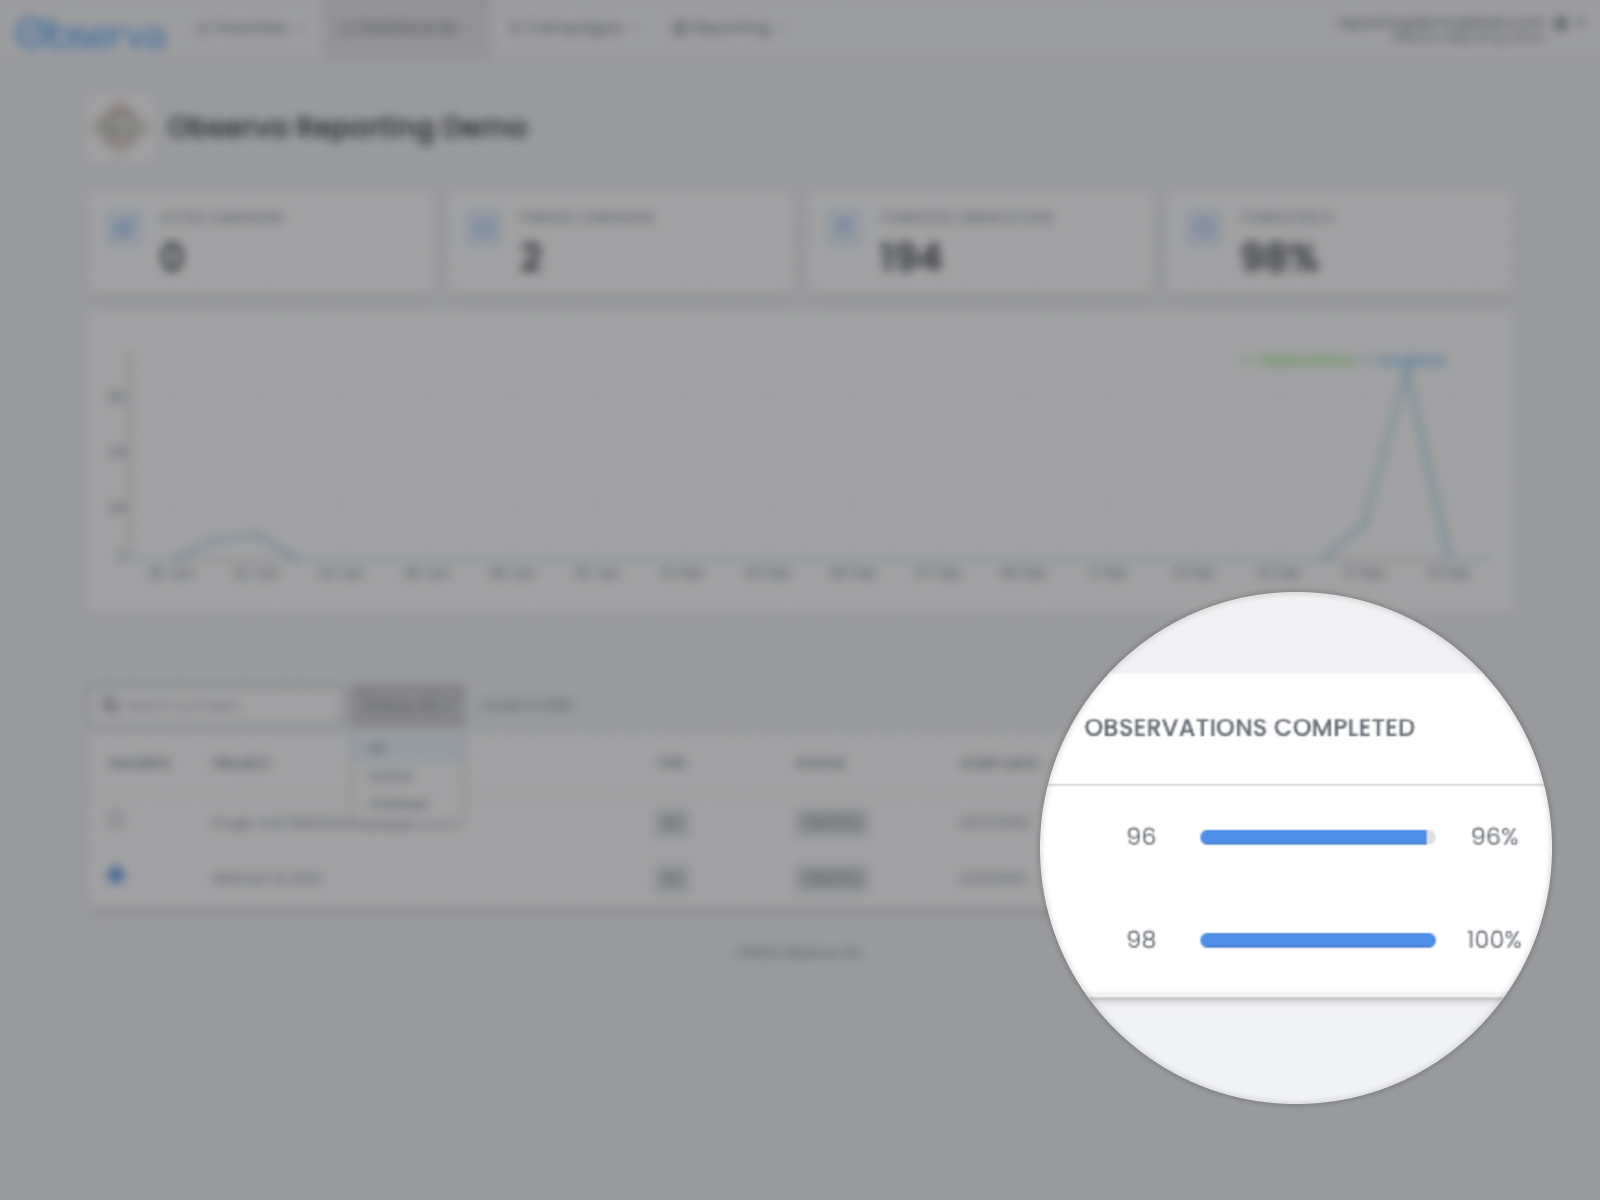
At a glance, see how many observations have been completed for your projects and campaigns.
All Projects Overview
At a glance, see how many observations have been completed for your projects and campaigns.
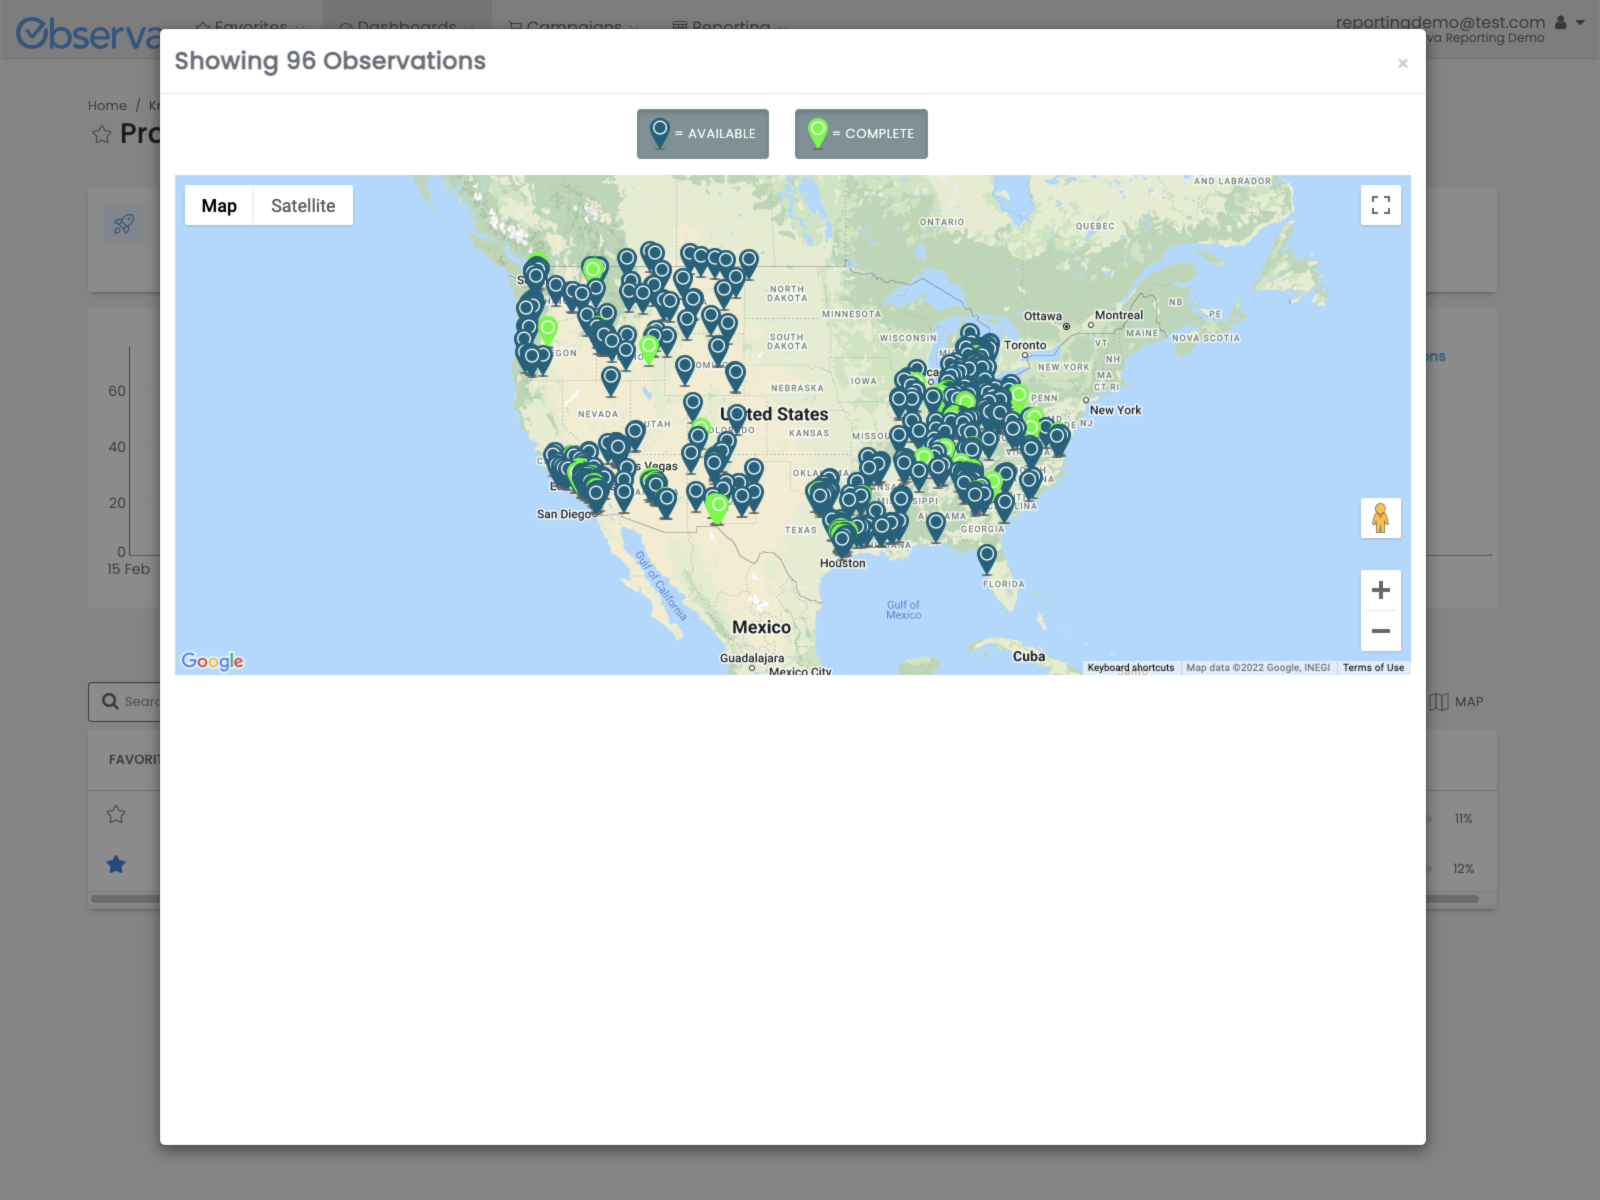
Activity Map
On a map, see where observations have been completed.
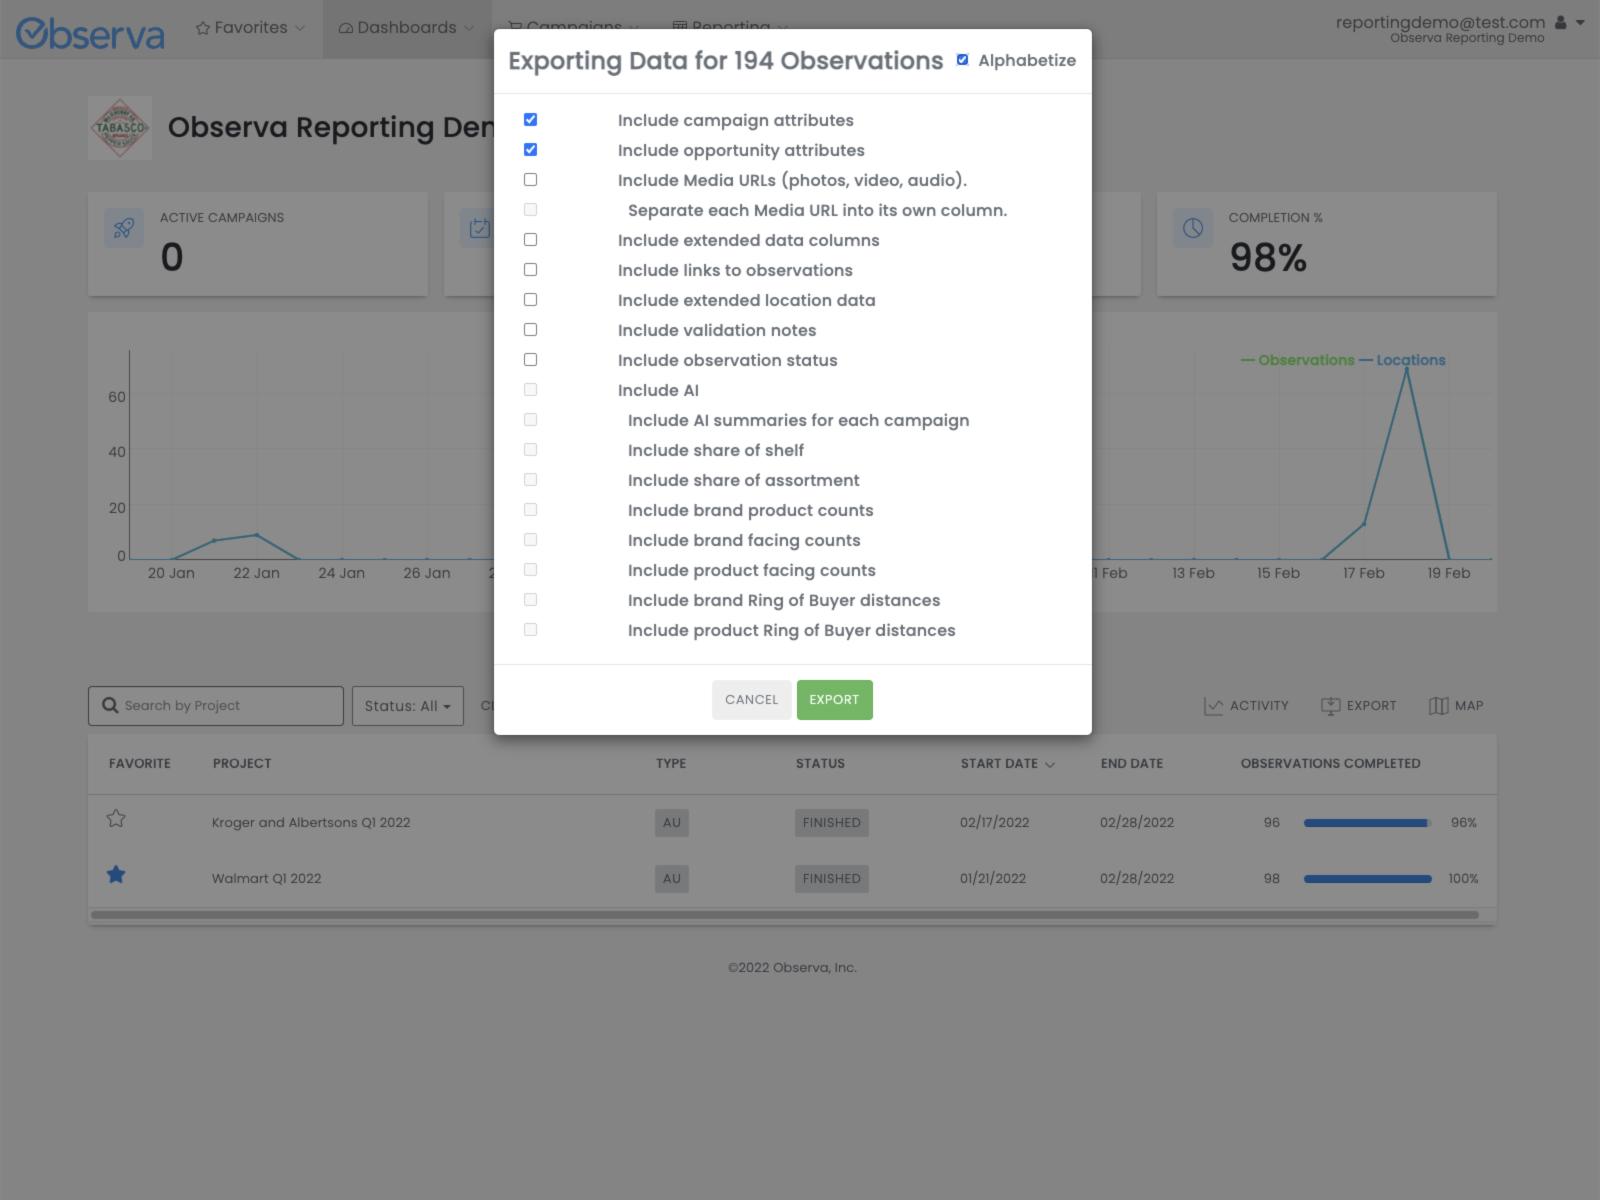
Export Data Easily
Quickly export all of your data in a single CSV file for use in other systems like Microsoft Excel or Salesforce.
Pre-Built Charts With Your Data
Observa has many pre-built charts to get an analysis of your specific data. Can be broken down by projects and campaigns. This comes automatically with our standard offerings and can be built for you if we are doing custom work for you.
Zoom in on Individual Observations
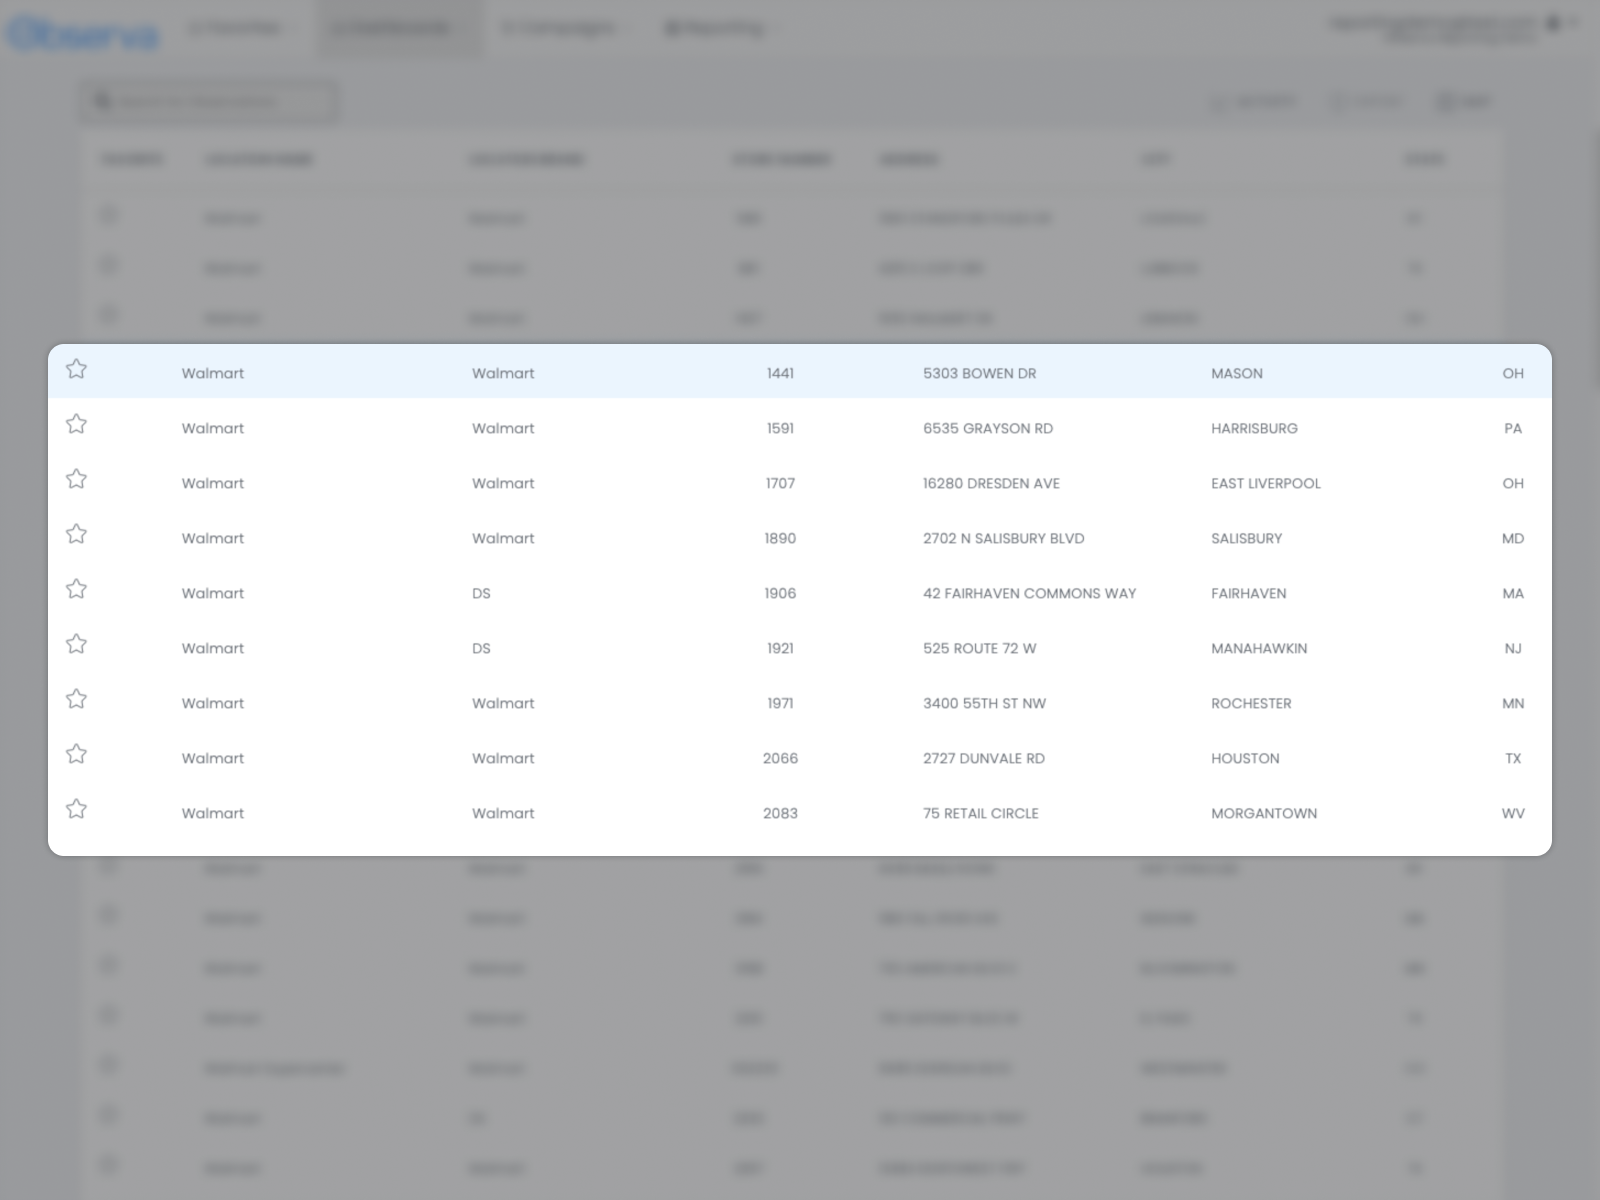
When you are looking at the campaign details, you can click on a specific observation and see the underlying data and images capture at that time and location.