In the wise words of management guru W. Edwards Deming, “Without data, you’re just another person with an opinion”—and that is not the type of person who gets big deals with retail stores. Strong, factual data can show product success and be the key to winning over stores and closing a sale.
“Big data” covers a wide range of information and can be overwhelming at first glance. For retail brands, analyzing data is becoming the best way to understand the consumer, and it is critical for overall success. An MIT study found that an estimated 30 percent of potential sales are lost because prices are not context- and customer-relevant. This is an easy fix with the incorporation of the right data about specific shoppers.
What type of data is accessible?
It is important to first understand what the numbers mean. Different types of data expose the strengths and weaknesses of brands and must be deeply understood to be used effectively.
Syndicated data
Large market research companies collect information from retailers and consumers to compile into industry reports. These reports cover all retail channels and vary in focus. Some can be customized for the owners of specific brands that pay for the research, while others are more overall industry updates. For these industry updates, companies pay for either singular reports or long-term subscriptions to keep up with consumer trends.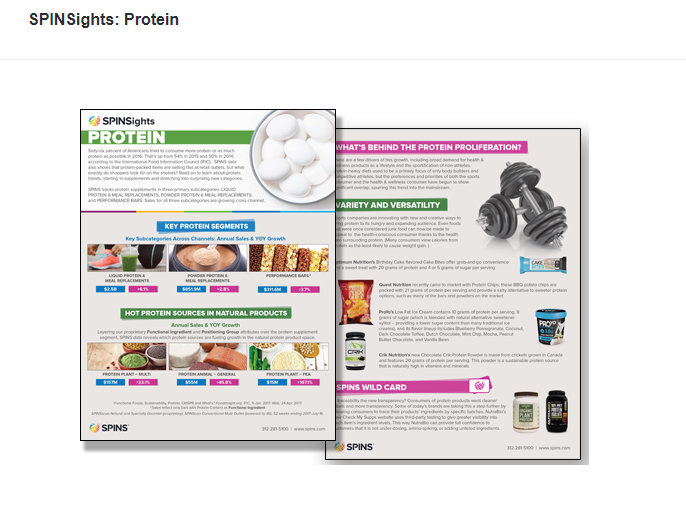
Some of the largest companies that collect syndicated retail data are Nielsen, IRI, and SPINS. An example report from SPINS on sales trends for protein-packed items can be found here. Clearly, absorbing this information could lead to a strong competitive advantage and allow brand owners to adjust their strategies as needed.
Store data
Direct retail data is collected by retailers by scanning all inventory that goes in and out of the store. This is useful for understanding a particular retailer’s product supply chain and assists in <astyle=”color: blue;” href=”https://www.forbes.com/sites/peterpham/2015/08/28/the-impacts-of-big-data-that-you-may-not-have-heard-of/#4279be5d6429″>lowering inventory risks and associated costs. However, it is limited to information only on the corresponding brand; it includes nothing about competitors. Furthermore, 81 percent of retailers charge big bucks for making this data available outside the company, considering that its collection is time-intensive. Many retail chains have their own platform, such as Walmart’s Retail Link. This site allows brand owners to monitor sales and inventory volume, in-stock percentage, gross margin, and inventory turnover.
Other retail chains use third-party services to collect and compile the information. Costco and Target, among many other big names, use RetailVelocity. Being able to log in at any time to look at the data is powerful and convenient, but subscriptions to these services can be steep.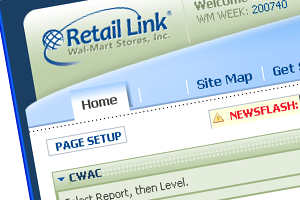
Distributor data
Similar to retailers, distributors track movement of product. For smaller companies that may not be able to afford the direct retail data, distributor data shows product in-flow by store location. This presents general information for how sales are doing in specific stores and potentially identifies voids in places where no product is being delivered.
Customer surveys
Customer surveys go right to the source: the consumer. They provide direct information on the opinions and satisfaction of purchasers. This allows companies to adjust the product as needed and proves that people enjoy the product, toward the aim of predicting future sales potential.
Surveys can cover a wide array of topics and probe for almost any information about consumers. SurveyGizmo suggests querying consumers about specific brand-related parameters: recall, recognition, identity, trust, image, and loyalty.
Forbes explains the effectiveness of surveys in understanding the consumer but explains that there is a protocol to create truly useful surveys. Questions must be open-ended and brief to get actual feedback. If surveys are thoughtfully constructed, the resulting data is direct and easy to analyze.
Observa data
Data from Observa, which aggregates observations from on-the-ground participants, provides real-time snapshots of what product looks like on the shelf. It can expose product voids or out-of-stock situations, validate compliance with the terms for a product demo or display, and give a clear view of store execution.
Breaking down the deals
Size of deal
For smaller stores or regions, a field representative is responsible for talking directly with the retailers or store employees. Typical conversations include discussion of the product, data analysis of previous successes, and a proposal for a deal.
Chains, on the other hand, require a brand’s corporate headquarters to give a more large-scale pitch. Syndicated data and customer surveys become key for proving a nationwide unmet need and providing evidence that strategies to address the need will succeed.
Length of deal
Stores are always hesitant to make changes, and therefore they do everything they can to protect their ROI when introducing new items. Deals are made with time restrictions to ensure that a product stays on the shelf only if it is doing well.
New deals vs. existing expansion
Walking into a store with a good pitch is no longer enough; retailers now want numbers and proof of success. Syndicated data proves the industry need, while direct retail data from other stores shows previous product success. Presenting a combination of these data types makes a strong argument that most retailers won’t be able to resist.
This data can also provide evidence to justify expansion in stores that the product is already in. With proof of product success or poor retail execution, some of the following requests can be made.
- More facings and/or shelf space. Many stores restock shelves only once a day. Therefore, if a product sells out in the morning and is not restocked until that night, potential purchases are lost. More facings allow more product on the shelf in between stocking periods.
- More inventory. Many out-of-stock situations are caused by lack of inventory in the back room, which can be mitigated by larger orders from retailers. If there are consistent inventory gaps, it is reasonable to request that larger orders be made.
- More SKUs. Stores will often accept only a few products of a brand to see if they succeed before carrying a full variety. By displaying the success of existing items, representatives can request that the store add additional SKUs.
- More stores. Success leads to more success. If product is showing obvious success in some stores, it is reasonable to assume that it’s time to expand to more stores.
Let the data speak
“A picture is worth a thousand words, while data is worth ten thousand.” All right, we may have made up that last part, but it is true. When presenting a potential sale to a retailer, data says more than most words ever could.
Aggregate all the data!
While each type of data is powerful in its own way, combining the knowledge is like catnip to retailers. By showing a store or chain syndicated data that proves a widespread need, direct retail data about product success, and Observa data measuring retail execution, stores will be excited and confident to make a deal.
Not convinced? Here’s some data.
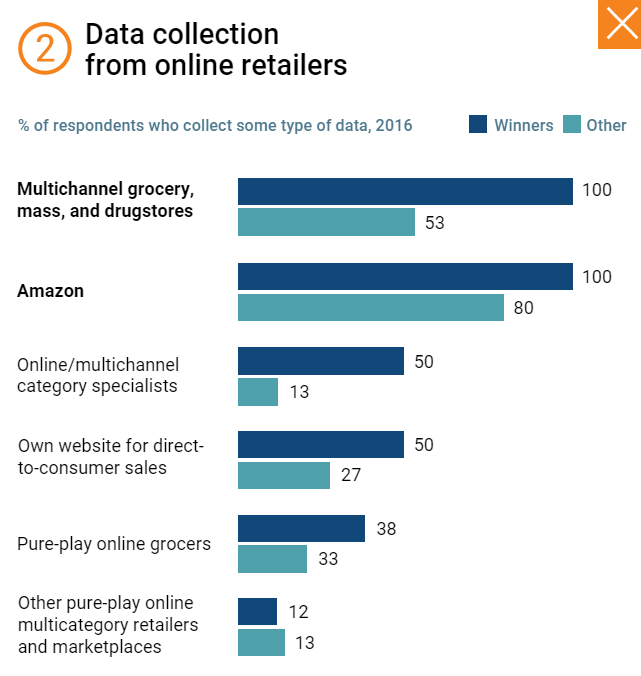 If this hasn’t been enough to convince you about the importance of data, check out a study done by McKinsey & Company. McKinsey defines companies that beat out their competitors as the “winners” (displayed in dark blue). It is apparent that big data collection puts brands significantly ahead of their competitors, as the winners use data collection for pricing, trade investments, and SKU portfolios to pull ahead. The power lies in the data.